
Energy Buying Opportunity
Energy Prices Plummet
Energy prices soared in the first half of 2008 along with most other commodities. As predicted, those commodities prices were unsustainable and the bubble has burst. The high prices were a major contributor to the worldwide economic crisis we are now facing. Now as businesses struggle we are seeing energy demand erode and prices fall.
The table below shows how natural gas futures prices have traded on the New York Mercantile Exchange (Nymex). You will notice how each of the next 12-monthly contracts is either at its 52-week low or had just made a new low. Many of these contracts are at 5-year lows! Most prices are well below their price from a year ago, and March is trading at 1/3 of its 52-week high price.
Natural Gas Futures Contract Month | Current Price $/MMBtu | 52-week Low | Date of Low | 52-week High | Date of High | Percent change from 2/4/08 |
Mar-09 | $4.417 | $4.355 | 1/26/2009 | $14.690 | 7/3/2008 | -50.01% |
Apr-09 | $4.489 | $4.428 | 1/28/2009 | $12.002 | 7/3/2008 | -44.38% |
May-09 | $4.574 | $4.500 | 1/29/2009 | $11.817 | 7/2/2008 | -43.24% |
Jun-09 | $4.689 | $4.607 | 1/28/2009 | $11.869 | 7/3/2008 | -42.28% |
Jul-09 | $4.819 | $4.731 | 1/28/2009 | $11.981 | 7/2/2008 | -41.15% |
Aug-09 | $4.914 | $4.828 | 1/28/2009 | $12.038 | 7/2/2008 | -40.43% |
Sep-09 | $4.970 | $4.895 | 1/28/2009 | $12.059 | 7/2/2008 | -39.82% |
Oct-09 | $5.097 | $5.020 | 1/28/2009 | $12.115 | 7/2/2008 | -38.69% |
Nov-09 | $5.672 | $5.611 | 1/28/2009 | $12.405 | 7/2/2008 | -33.42% |
Dec-09 | $6.272 | $6.225 | 1/30/2009 | $12.750 | 7/2/2008 | -28.52% |
Jan-10 | $6.552 | $6.500 | 1/23/2009 | $12.946 | 7/3/2008 | -27.03% |
Feb-10 | $6.567 | $6.520 | 1/23/2009 | $12.881 | 7/3/2008 | -26.90% |
These prices present an excellent buying opportunity for those wanting to lock-in fixed rates for longer term agreements. For commercial and industrial customers with good credit ratings, we are seeing companies seeking to buy natural gas and/or electric supply, for as long as the next 4-5 years.
Contact Independent Energy Consultants to obtain a free quote for your natural gas or electric needs.
Is Supply Drying Up?
Now that we have identified this as an excellent buying opportunity, a logical question would be - could prices go even lower? Our answer is a definite, yes. While the magnitude of potential price increases is much greater than the potential for decreases(energy prices cannot go to zero), we will need to see the economy start to recover before the downward trend reverses. At this time all technical indicators continue to point to further downside potential. For end-use consumers the trend remains your friend.
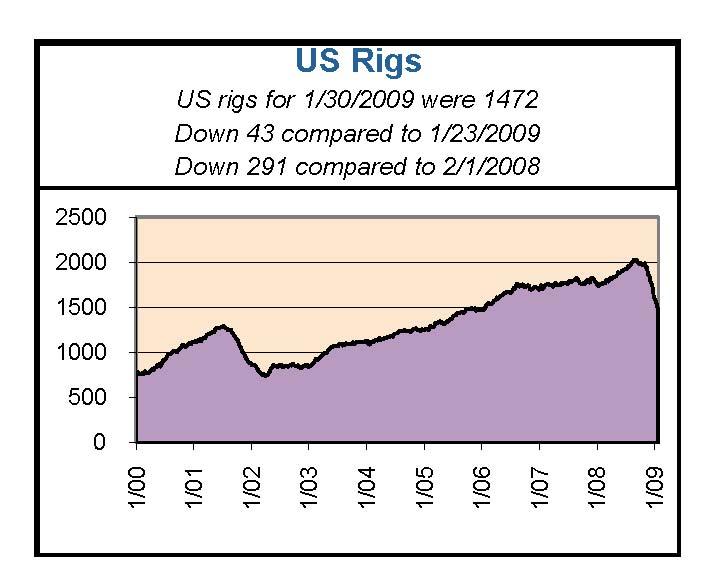
The chart above (courtesy of Baker Hughes Inc.) shows how suppliers have reacted to falling prices. They are shutting down oil and natural gas rigs as fast as they can. When the economy starts to rebound and demand outpaces supply, we could see prices shoot up rapidly. It took significant demand erosion to turn the tide of rising prices, it will now take serious supply erosion to send prices back up. We may not see a supply/demand equilibrium for months, but it is definitely on the way. You can see that the rig count had been on a steady 7-year climb as producers responded to rising prices. That trend reversed itself in Q4 2008, and we now are approximately 30% below the peak.
It is also interesting to note that we are still recovering from the impacts of hurricanes Gustav and Ike. Those category 3/4 hurricanes rivaled hurricanes Rita and Katrina in strength and the path they took, but had virtually no impact on energy prices.The Minerals Management Services (MMS) estimates that 11.0% of the oil production in the Gulf of Mexico and about 15.0% of the natural gas production in the Gulf is still shut-in from Hurricanes Gustav and Ike last September. Personnel are still evacuated from 34 production platforms, equivalent to 4.9% of the 694 manned platforms in the Gulf. The MMS previously reported that 23 manned platforms were destroyed by Ike. This will be worth remembering if the storm forecasters predict another bad year. The 2009 hurricane forecasts will be released in April.
Independent Energy Consultants looks at rig counts as one of many inputs in our daily market analysis. Contact us if you would like help meeting your energy purchasing objectives.